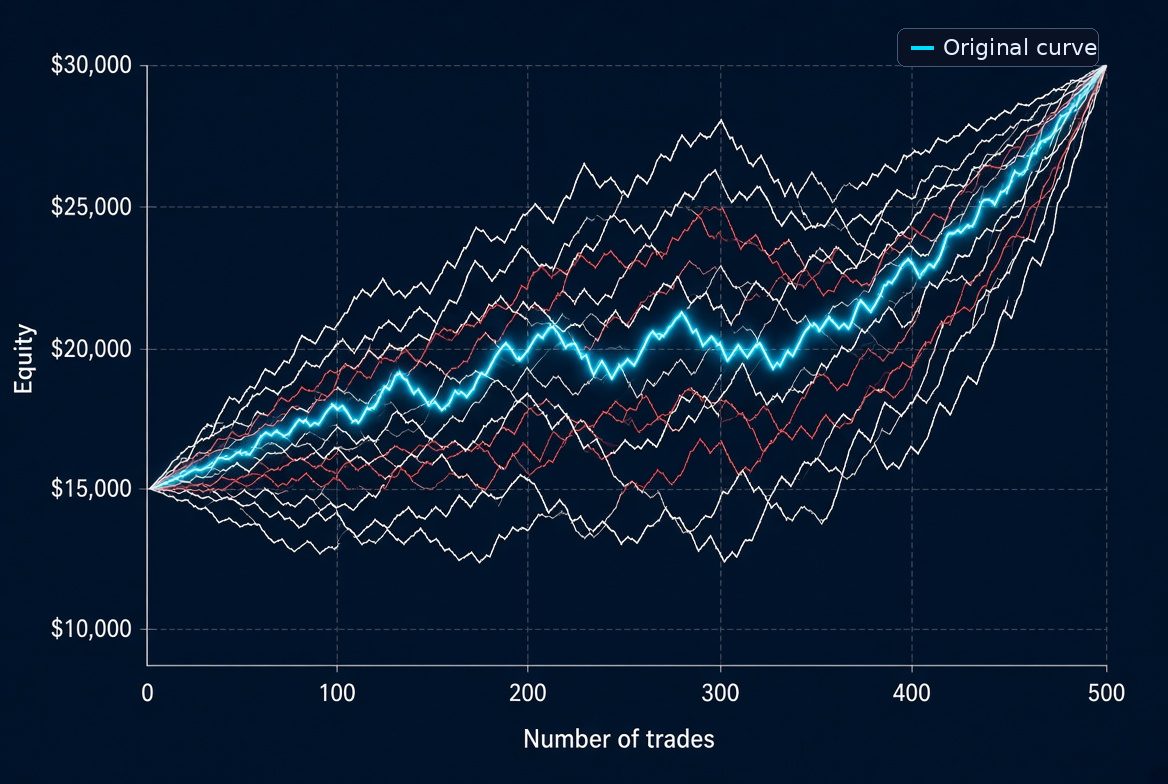
A backtest gives you one sequence of trades.
That sequence produces one equity curve, one maximum drawdown and one final balance. It is useful, but there is an obvious limitation: the market did not have to give you those trades in that particular order.
Imagine an EA makes $10,000 over 500 trades. The backtest looks good, and the maximum drawdown is only 18%. But what happens if the losing trades that appeared at different points in the backtest had occurred closer together?
The final profit could still be exactly the same. The drawdown could be very different.
That is where Monte Carlo simulation becomes useful.
Instead of asking “How did my EA perform in this backtest?”, you are asking:
“How sensitive is my EA to the order in which its trades occur?”
For an EA that is going to trade a live account, that is an important question.
What Monte Carlo simulation actually changes
There is a common misunderstanding about Monte Carlo testing.
It does not create new market data. It does not magically test your EA on another year of price history. And it does not prove that your strategy has a genuine trading edge.
For a simple Monte Carlo sequencing test, you take the individual trade results from your existing backtest and randomize their order.
Suppose the backtest produced these five trades
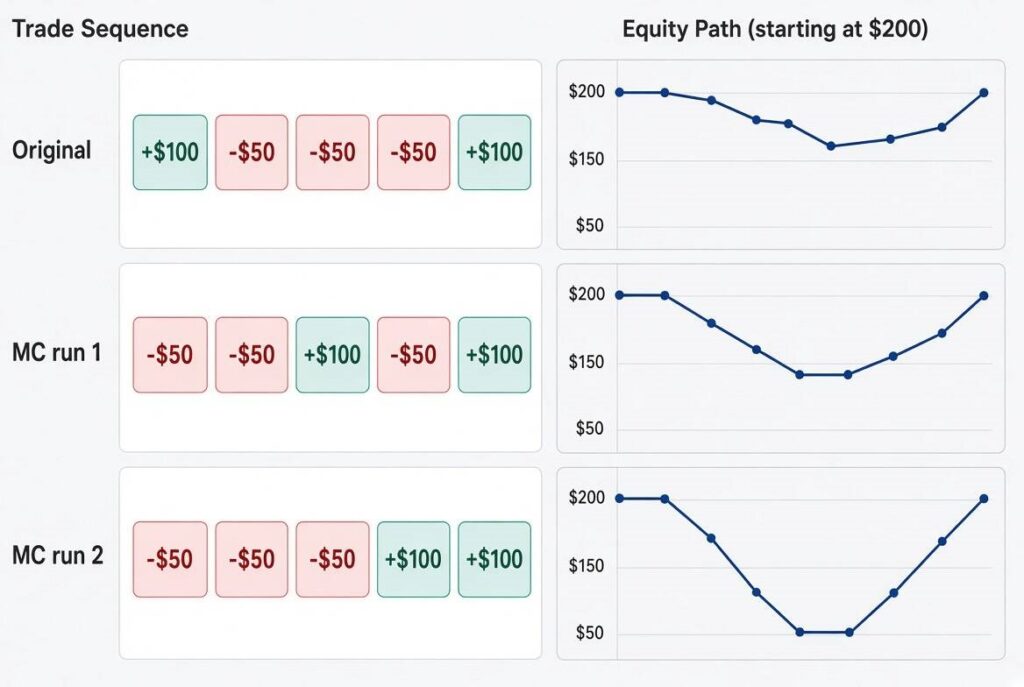
The trades themselves have not changed. Their order has.
And that matters because drawdown depends heavily on what happens before the account has recovered.
Starting with $200, the original sequence reaches a low of $150. The second sequence reaches $50 before the profitable trades arrive.
Both sequences finish at $250.
The backtest only shows you one of them.
How the simulation works
The basic process is straightforward:
- Export the individual P/L of every trade from the backtest.
- Randomly shuffle those results.
- Start again from the original account balance.
- Rebuild the equity curve using the shuffled trades.
- Record metrics such as maximum drawdown and final balance.
- Repeat the process thousands of times.
A few thousand runs are normally enough to get a useful picture. For example, you might run 5,000 or 10,000 simulations.
Here is a simple Python implementation:
import numpy as np

trade_results = [...]  # Individual trade P/L values
n_simulations = 5000
starting_balance = 10000

max_drawdowns = []
final_balances = []

for _ in range(n_simulations):
    shuffled = np.random.permutation(trade_results)

    equity = starting_balance
    peak = equity
    worst_dd = 0

    for trade_pnl in shuffled:
        equity += trade_pnl

        if equity > peak:
            peak = equity

        drawdown = (peak - equity) / peak
        worst_dd = max(worst_dd, drawdown)

    max_drawdowns.append(worst_dd)
    final_balances.append(equity)

print(
    "95th percentile drawdown:",
    np.percentile(max_drawdowns, 95)
)

print(
    "Probability of equity falling below 50%:",
    np.mean(
        np.array(final_balances) < starting_balance * 0.5
    )
)
The important part is not the Python code itself. The important part is what happens after you run it.
You now have thousands of possible equity curves instead of one.
Which numbers should you look at?
Running 5,000 simulations gives you 5,000 maximum-drawdown figures.
That distribution is much more useful than simply looking at the original backtest drawdown.
Original maximum drawdown
Keep the original backtest drawdown as a reference.
For example:
Backtest maximum drawdown: 15%That tells you what actually happened in the historical sequence.
It does not tell you how bad the drawdown could have been if the same trades arrived in a less favourable order.
95th-percentile drawdown
This is one of the more useful numbers for risk planning.
If the 95th-percentile drawdown is 38%, it means roughly 95% of the simulated sequences had a maximum drawdown at or below that level, while about 5% were worse.
So if your original backtest shows:
Maximum drawdown:          15%
Monte Carlo 95% drawdown: 38%
you should be very careful about sizing the account based only on the 15% figure.
The EA did not suddenly become worse. You are simply seeing how much the result depends on trade sequencing.
Probability of hitting a critical loss level
You can also define a level that would be dangerous for the account.
For example:
Starting balance: $10,000
Critical level:    $5,000
If 6% of your simulations fall below $5,000, that is a warning sign.
It does not mean there is literally a 6% probability that the EA will lose half your account in live trading. Monte Carlo is based on assumptions about the historical trade sample, and live markets can behave differently.
What it does tell you is that the historical trade set contains sequences capable of producing that level of damage.
That is useful information when deciding how much risk the EA should take.
Two ways to build the simulations
There are two common approaches.
1. Shuffle the existing trades
This is the simplest approach.
You keep every historical trade exactly as it is and only change the order.
Trade results:
+100
-80
+150
-40
-60
+120
Every simulation uses those same six trades.
Only the sequence changes.
This is a good way to isolate sequence risk.
2. Bootstrap the trade results
Bootstrapping goes a step further.
Instead of using every trade exactly once, each simulation randomly selects trades from the historical pool with replacement.
That means a particular trade can appear more than once in a simulation, while another historical trade might not appear at all.
This introduces another source of variation and can show how dependent the results are on particular trades or outliers.
However, the quality of the result depends heavily on the size and quality of your original trade sample. A Monte Carlo test based on 30 trades should not be treated with the same confidence as one based on several hundred trades.
For a practical EA robustness test, I would first make sure the underlying backtest itself contains a meaningful number of trades before putting too much weight on the simulation statistics.
What Monte Carlo does not tell you
This is just as important as what it does tell you.
Monte Carlo sequencing does not test whether your EA can handle a completely different market environment.
If your backtest covered 2018–2025, the simulation is still using the trades generated during 2018–2025.
It does not answer questions such as:
- Does the EA still work in a different volatility regime?
- Does the strategy survive a prolonged trend when it was mainly developed during ranging markets?
- Does the strategy work on data it was never optimized on?
- Is the EA overfitted to a particular historical period?
- Will execution behave differently with live spreads, slippage and latency?
Those require other forms of testing.
Walk-forward testing and out-of-sample testing are particularly important here.
The distinction is simple:
These methods complement each other. A good robustness process should not rely on Monte Carlo alone.
An EA can have a good backtest and still fail the Monte Carlo test
Consider two EAs.
EA A:
Backtest profit:       +$20,000
Backtest drawdown:       12%
Monte Carlo 95% DD:      17%
EA B:
Backtest profit:       +$20,000
Backtest drawdown:       12%
Monte Carlo 95% DD:      41%
On the normal backtest, they look almost identical.
But they are not equally robust.
EA B is much more sensitive to the order in which its trades occur. Its historical sequence happened to produce a relatively comfortable equity curve, but many alternative sequences create substantially larger drawdowns.
That should influence how aggressively you trade it.
This is particularly important for EAs using high position sizes, recovery logic, grid-style entries or strategies where a cluster of losses can put significant pressure on account equity.
Don’t use Monte Carlo to make a bad EA look good
Monte Carlo is a robustness test, not a strategy-validation shortcut.
If the original backtest has no meaningful edge, randomly rearranging its trades will not create one.
Likewise, if the EA has been heavily optimized against historical data, Monte Carlo cannot replace testing it on unseen data.
A sensible testing sequence is something closer to:
Historical backtest
        ↓
Out-of-sample / walk-forward testing
        ↓
Monte Carlo robustness testing
        ↓
Stress testing
        ↓
Demo / controlled forward testing
        ↓
Live deployment with appropriate risk
The exact order can vary, but the important point is that each test answers a different question.
The takeaway
Your backtest gives you one historical path.
Monte Carlo gives you thousands of possible paths based on the same underlying trade results.
That makes it particularly useful for answering a question the normal equity curve cannot:
What happens if my EA gets unlucky with the order of its trades?
If the original backtest shows a 15% drawdown and thousands of randomized sequences regularly produce 35–40% drawdowns, that is something you want to know before putting real money behind the EA.
It does not prove that the EA will survive the future. Nothing in a backtest can do that.
But it can expose a weakness that a single, neat-looking equity curve can easily hide.
For an EA being prepared for live trading, Monte Carlo is a relatively inexpensive test to add to the robustness checklist—and it is far better to discover a sequencing problem in a simulation than in your live account.
If you want to know whether your EA has other robustness issues beyond its standard backtest, you can also submit it for our free EA diagnosis.